Project Summary
Steps of Socio-Demographic analysis to find your ideal home location from Population Density to Homes without mortgage
Project Map Description
Project Maps
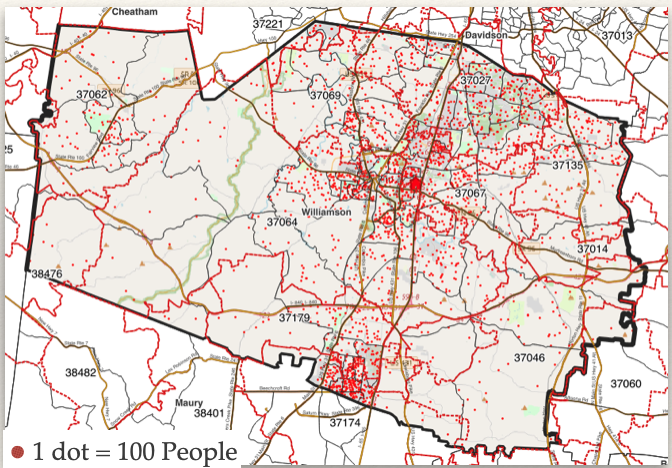
Population Density
Williamson County’s population is concentrated mainly on a North-South axle along the I-65, with the highest concentrations in and around Franklin and Thompson Station/Northern Spring Hill.
The Western section as well as the Southeastern area are the least populated parts of the county, reflecting the more rural character.
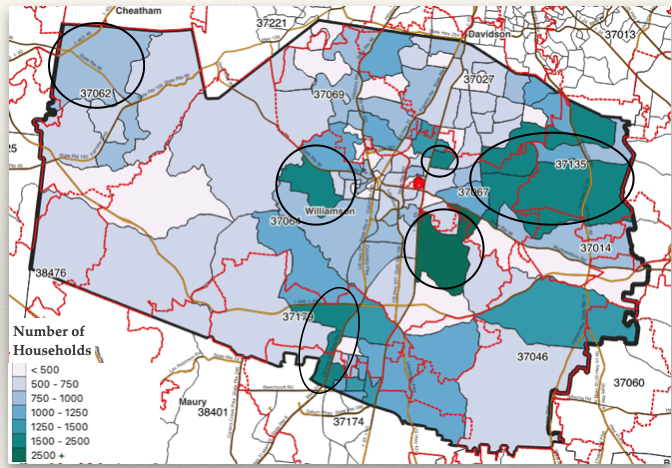
Number of Households
The number of households follow the the general pattern of the population density, with a few exceptions:
Some areas show a high number of households, while the population density is not very high (previous mao).
Looking at the Median Age (next map) reveals a potential cause.
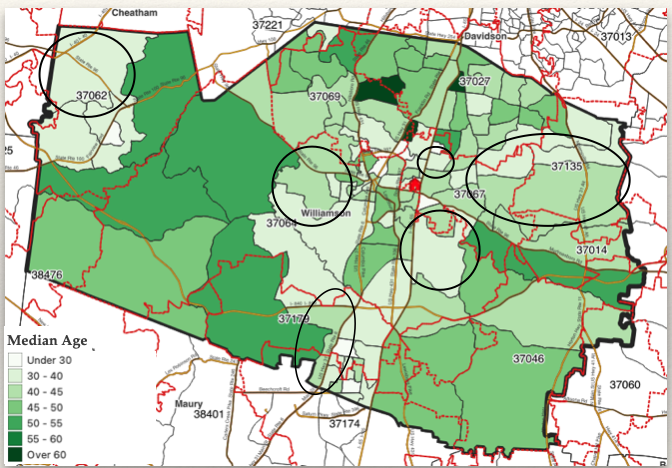
Median Age
Areas with a high number of households, yet a relative low population density coincide with an overall younger population.
It appears that singles or younger families with small children dominate these areas of Williamson County.
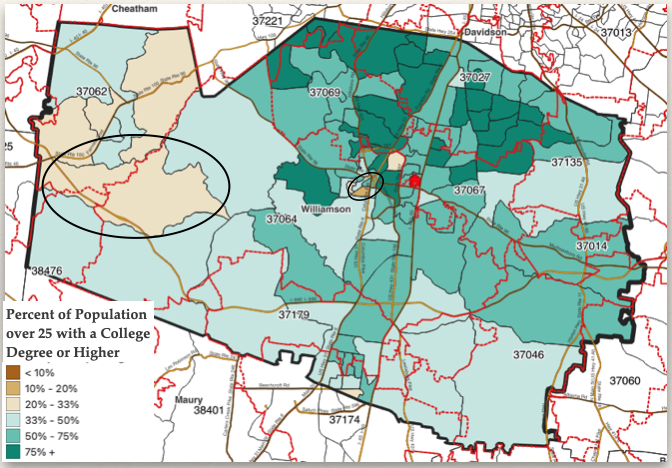
Educational Attainment
Education levels are high in Williamson County. Over 50% of the population over 25 years has a college degree or higher.
Again, there are a few exceptions: The Western rural part of the county and a small pocket to the Southwest of Franklin show lower educational attainment levels.
These areas coincide with a higher unemployment level (see previous map).
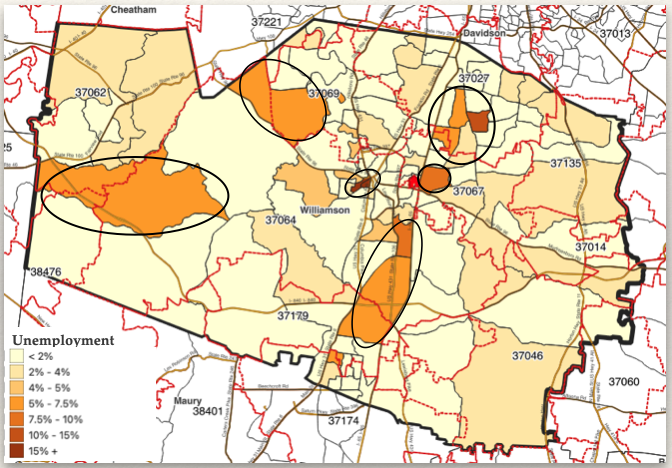
Unemployment
Unemployment does not play a big role in Williamson County, with most areas well below the national average.
Exceptions are a few small areas Southwest of downtown Franklin and a few areas to the (North)East and the rural West.
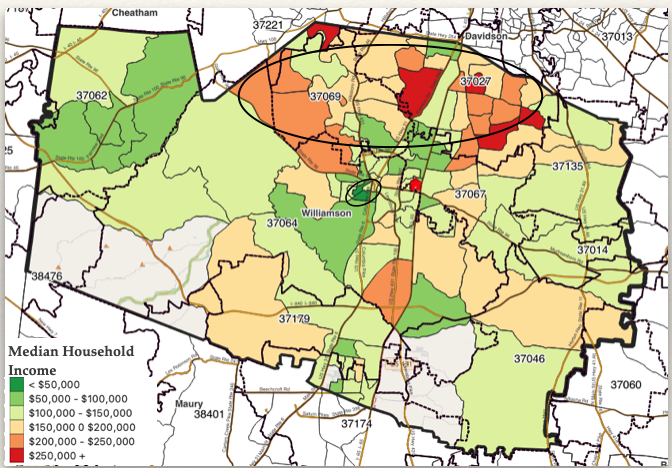
Median Household Income
Education and income are usually positively correlated. Williamson County is no exception.
In general the area North of Franklin (Brentwood and surrounding areas) has the highest income levels in the county, while the area Southwest of downtown Franklin has on the lowest median income.
Note: Due to the relatively low number of households per Block Group, some Block Groups have no data associated with this metric.
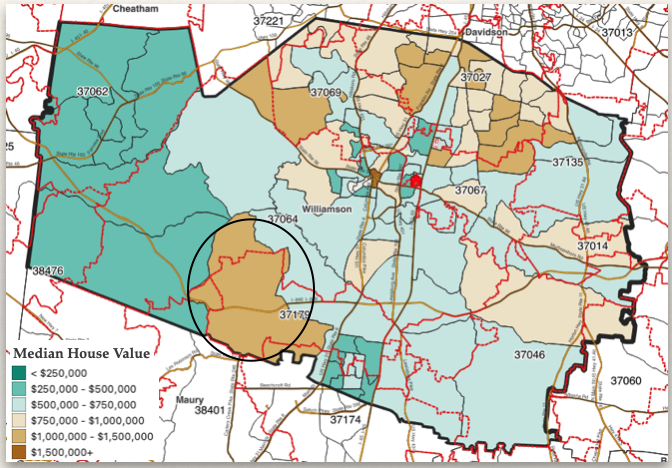
Median House Value
House values reflect people’s ability to pay for it, which is correlated to their age and educational attainment levels. Accordingly, the highest house values can be found in and around Franklin and towards the North and East of the county. There is only one area in the South of the county with a Median House Value of over $1,000,000: The Western part of Zip Code 37179, around the intersection of Carters Creek Pike and the I-840.
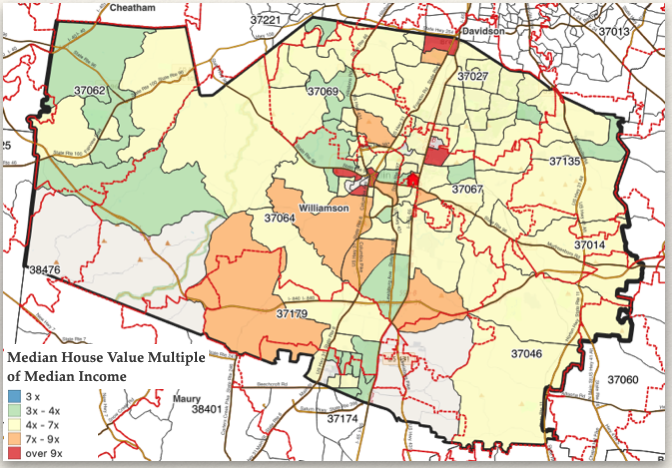
Median House Value Multiple
While house values are one side to the affordability equation, income is the other. This map shows how much households must stretch to be able to afford a median priced home. While a rough rule of thumb is that a house price should not be more than 3 times an annual income, Williamson County’s majority area is at 4x or more, with some areas reaching over 9x the median income of that area. This might be caused by a massive transitional phase: People from outside this area with above local incomes are able to purchase homes mostly out of reach by the traditional population.
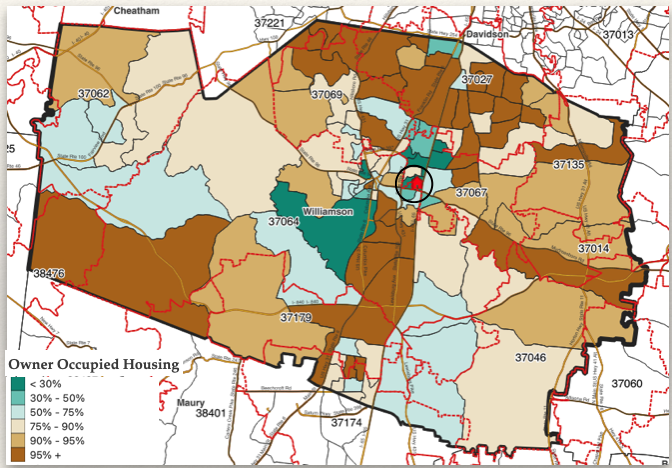
Owner Occupied Housing
Most occupied properties in Williamson County are owner occupied. Areas around Franklin tend to have more renters, reflecting the much higher numbers in apartment complexes in this area.
Local knowledge is also required to interpret this map, as some Block Group areas are containing apartment complexes that outnumber owner occupied housing, yet the overall feel is still one of a typical owner occupied neighborhood (see circle).
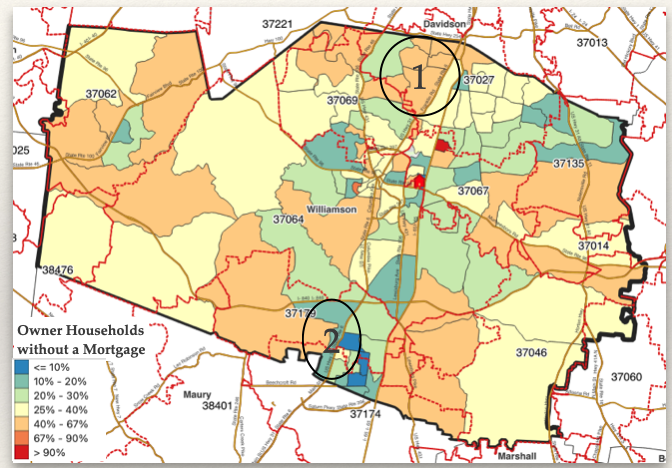
Homes without Mortgage
The number of owner occupied homes without a mortgage is high in Williamson County, with many areas above the Tennessee average of 42%.
Interesting are areas where either 1) the house prices are high, yet the number of mortgage free owners is also high or 2) the number of owner occupied housing is high and the number of mortgage free owners is low. In the first case, owners are either older and were able to pay off the mortgage or are wealthy enough to be mortgage free. In the second case one would find more younger families that are starting out with a new home. In case of the area in circle 2, it correlates with an earlier observation of younger families in this area.